Sample report part 8: ROA analysis according to DuPont in the FRR
In this excerpt from the Financial Risk Report, we examine the return on assets (ROA) of Muster AG using the DuPont analysis.
BAMAC Group’s Financial Risk Report is the tried and tested tool for supplier evaluation. Numerous investigations are carried out within the report in order to guarantee a comprehensive result. In this excerpt from the Financial Risk Report, we examine the return on assets (ROA) of Muster AG using the DuPont analysis.
The DuPont analysis in general
The DuPont analysis provides a quick overview of a company’s financial position and performance. It makes it possible to better understand the causes of changes in the ROA. For example, if ROA is rising or falling, DuPont analysis can help determine whether this is due to an improved net profit margin, more efficient use of assets or a change in capital structure.
In other words, the DuPont analysis provides insights into the efficiency of business performance by distinguishing between operations and financing. In this context, operations refers to how effectively a company converts sales into profits. This figure is also known as the operating margin. The keyword financing, on the other hand, describes how effectively a company converts assets into profits and is described as asset turnover.
Key efficiency figures
Let’s be more specific and take a closer look at the key figures for calculating efficiency. In order to calculate the return on assets, we need the operating margin and the asset turnover.
The operating margin measures how much operating profit a company generates for every euro of turnover. Interest, taxes and any investment expenses or income are not taken into account.
Asset turnover measures how much turnover a company generates for every euro of total assets.
As already indicated, the operating margin and asset turnover provide information on the above-mentioned dimensions of efficiency. Multiplying these gives the return on assets. This key figure makes it possible to make a solid comparison of the financial performance of different companies.
Results of the analysis for Muster AG
In the Financial Risk Report, we present a version of the DuPont analysis that focuses on operational efficiency, as it is an important factor in the financial strength of companies.
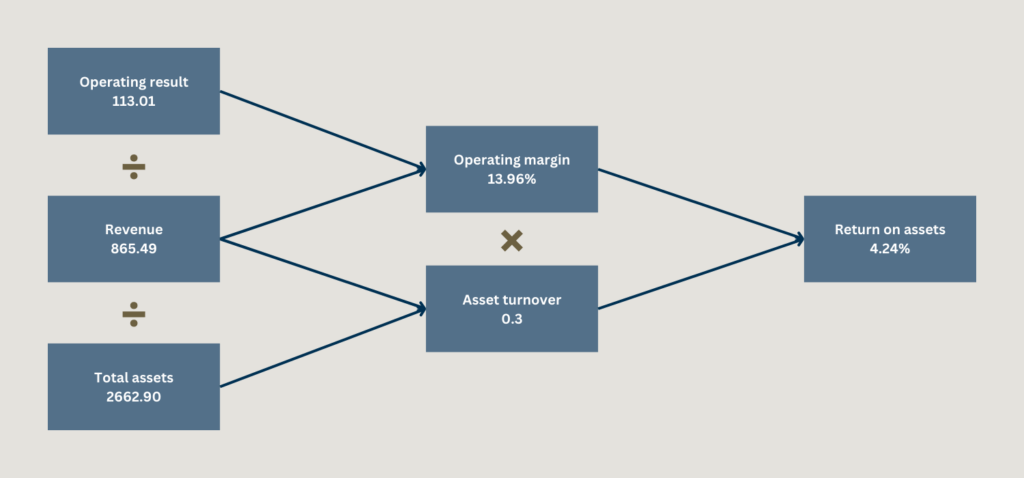
Muster AG has an operating margin of 13.06%, which means that the company generates an operating profit of EUR 13.06 per EUR 100 of sales.
The asset turnover of Muster AG is 0.33, which means that it generates EUR 33 in sales per EUR 100 in total assets.
The illustration shows the calculation process once again:

The DuPont analysis showed that Muster AG generated a total return on capital of 4.24%. This means that the company generated an operating profit of EUR 4.24 per EUR 100 of total assets for the period under review.
This result corresponds to an average value compared to the rest of the sector.
In the next and final part of our FRR blog series, we take a look at the balance sheet in the perspective of the FRR. For all other parts of the Financial Risk Report and the detailed descriptions, see the further blog posts below.
Categories of this post
Further interesting posts.


